
Tick Chart Scalping Strategy for NSE Intraday Trading
Scalping on the NSE can feel like trying to catch water with your bare hands—fast, intense, and requiring absolute precision. But with the right framework, tick chart scalping becomes a systematic approach to capturing the market's smallest, most frequent price movements.
This is not a strategy for passive traders. It demands your full attention, quick decision-making, and ironclad discipline. But for those willing to commit, it offers high trade frequency, defined risk on every entry, and the satisfaction of reading pure price action.
What Is Tick Chart Scalping?
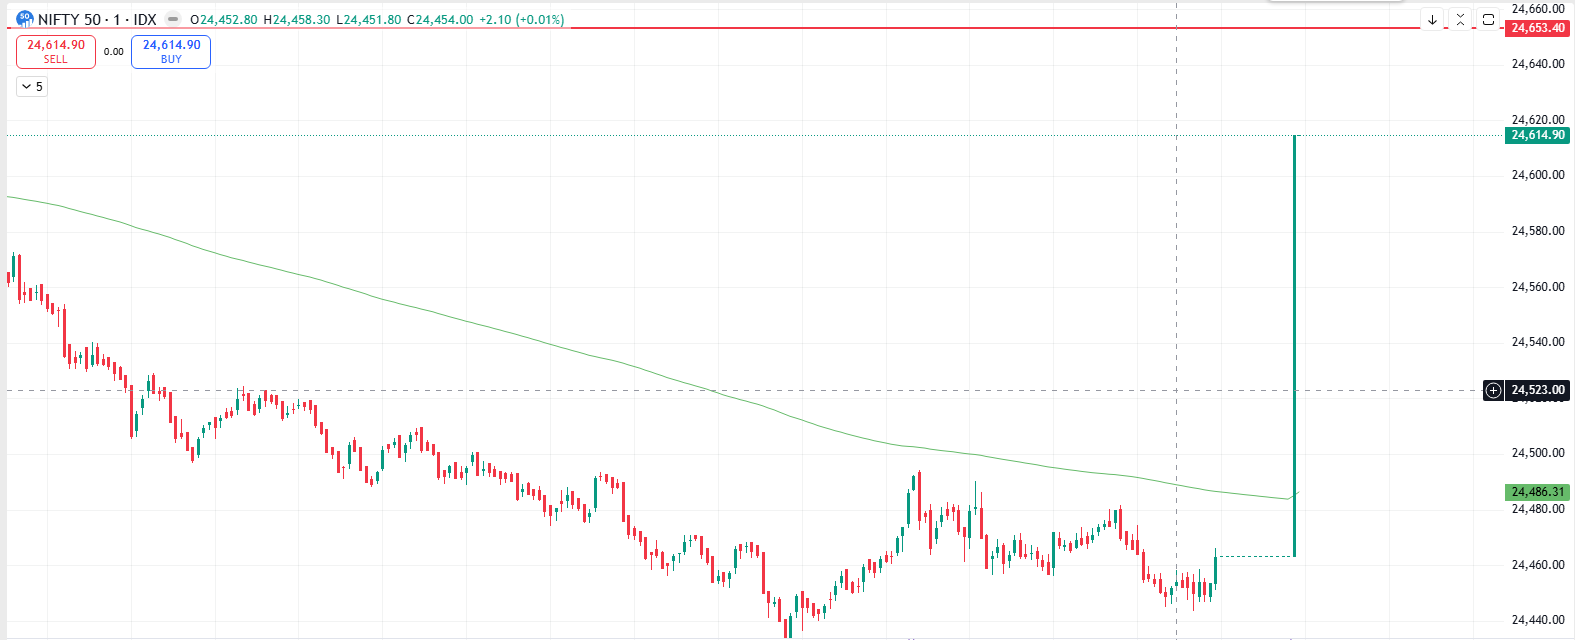
Tick chart scalping is a momentum-based intraday strategy that trades on 1-minute and 5-minute timeframes on NSE charts. Unlike traditional bar or candlestick charts that form at fixed time intervals, a tick chart forms a new bar every time a set number of trades (ticks) occur—regardless of time passed.
This makes tick charts particularly useful for scalping because they respond more directly to market microstructure: surges in buying or selling volume create bars immediately, rather than forcing you to wait for a fixed time period to close.
The strategy focuses on two core inputs:
- Price Action: Support/resistance, breakouts, and momentum exhaustion
- Volume: Confirmation of move strength and entry conviction
The goal is simple: identify brief directional moves with momentum confirmation, enter with a fixed stop loss, and exit as soon as your profit target or invalidation signal is hit.
How Tick Chart Scalping Works on NSE
On the NSE, liquid large-cap stocks (Nifty50 components, banking stocks, IT names) generate enough tick flow for this strategy to be viable. During market hours, a 50-tick or 100-tick chart can produce 10-20+ bars per minute on high-volume scrips.
The strategy thrives on the observation that price does not move smoothly. Instead, it clusters—brief surges of buying or selling pressure followed by momentary consolidations. Your job is to identify these clusters and ride them.
Here's the operational flow:
- Monitor a tick chart (typically 50-100 ticks per bar) during live market hours
- Watch for price to break a recent high/low with volume confirmation
- Enter on the breakout bar or the pullback into the breakout level
- Place a stop loss just beyond the recent swing point
- Hold until your profit target (fixed risk/reward ratio) or exit signal is triggered
Entry and Exit Rules
Entry Signals
Classic entry setups include:
- Breakout of a two-bar range: Price closes above the high of the prior two bars with volume spike
- Pullback into support/resistance: Price retraces to a broken level and bounces with volume
- Momentum divergence: Price makes a new high but volume does not—often signals reversal
- Volume climax: Sudden volume surge on a directional move often precedes a brief reversal
Exit Signals
Discipline on exits is non-negotiable:
- Profit target: Close position at a fixed R:R ratio (e.g., 1:1, 1:1.5)
- Stop loss: Exit if price closes beyond your initial swing point stop (typically 1-2 ticks)
- Time exit: Close if the trade has been open for more than 3-5 minutes with no progress
- Invalidation: If the setup breaks in structure (e.g., a support breakout re-closes above support), exit immediately
When to Use Tick Chart Scalping
This strategy works best under specific conditions:
- High-liquidity stocks: Nifty50 index constituents, liquid midcaps
- Market hours 9:15–11:30 and 2:30–3:30 PM IST: When volume and volatility are elevated
- Trending days: Scalping is easiest on days with directional bias, not choppy sideways action
- Full availability: You must be able to monitor charts continuously; this is not a set-and-forget strategy
Common Mistakes in Tick Chart Scalping
Even experienced traders stumble here:
- Chasing: Entering too late after the move has already accelerated—results in poor risk/reward
- Ignoring volume: Taking price action entries without volume confirmation leads to whipsaws
- Moving stops: Loosening your stop loss mid-trade to 'give the trade room' erodes your defined risk discipline
- Overtrading: Taking every signal instead of filtering for high-probability setups exhausts focus and capital
- Screen fatigue: After 2-3 hours of intense focus, decision quality declines sharply
Putting It All Together
Tick chart scalping is not for everyone. It demands mental stamina, real-time decision-making, and strict adherence to your rules. But if you have the temperament for it, the NSE's liquid stocks offer enough tick flow to make this strategy viable on a consistent basis.
The key is rigorous preparation: backtest your exact entry and exit rules, practice live paper trading first, and only move to real capital once you've internalized the feel of your setups.
Ready to Test This Strategy?
Understanding tick chart scalping in theory is one thing. Seeing how it backtests on real NSE data is another. Head over to Momentum IQ—our NSE trading strategy research platform—to backtest this tick chart scalping approach on your preferred stocks and timeframes. Build conviction through data, then execute with confidence.
Try it yourself: Tick Chart Scalping
Run this exact strategy on any NSE stock with your own parameters.
More in Strategy Guides
Auction Market Theory for NSE: A Beginner's Price Action Guide
Pivot Bounce Strategy for NSE: A Beginner's Guide
Pin Bar Strategy for NSE: A Beginner's Guide to Price Action Trading
Artificial Intelligence Trading Strategy for NSE Markets

