Intermediate★ Very High NSE FitDaily9/10 Popularity
Uses the Volume Weighted Average Price as a dynamic support and resistance level. Extremely well-suited for NSE intraday trading — VWAP is the most widely watched institutional reference level on Indian markets.
Complexity
Intermediate
Easy to implement
NSE Suitability
Very High
9.2 / 10 score
Timeframe
Daily
Short to medium term
Best For
Swing & Positional Traders
3–15 days moves
Indicators Used
1
VWAP
Win Rate (Backtest)
0%
Below 50% threshold
Avg Return / Trade
-0.52%
Per trade, after costs
Max Drawdown
-1.9%
Within typical range
Trades / Year
3
Small sample — interpret with caution
About the Anchored VWAP Strategy
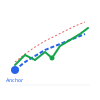
Anchored VWAP is a mean-reversion and trend-confirmation strategy that fixes the Volume Weighted Average Price calculation to a significant price level or event rather than the session open. This approach captures the market's perception of fair value from that anchor point forward, making it useful for identifying when price has drifted too far from established reference levels.
On the NSE, anchored VWAP works well because Indian equity markets exhibit strong intraday volatility patterns and liquid order flow, particularly in largecap stocks and index futures. The strategy exploits the tendency for price to oscillate around these dynamic anchors during the trading session, especially within the liquid morning hours and around key market events.
A typical setup looks for price to move meaningfully away from the anchored VWAP, signaling either exhaustion of a move or a continuation setup depending on volume confirmation. Traders use the distance between price and the anchor as a measure of conviction, entering when reversals show signs of completion or when breakouts gain volume support above or below the line. The daily timeframe allows traders to set anchor points at the previous close, a swing level, or a news event, then monitor how price and volume interact with that reference throughout subsequent sessions.
Who This Strategy Is For
This Intermediate strategy suits Swing & Positional Traders comfortable with a Daily timeframe and holding periods around 3–15 days. It's built for the Equity, Futures segment on NSE, so it fits traders who can check positions without needing intraday execution speed.
Equity Curve (Backtest)
HIGH QUALITY
Tested on: TATASTEEL
· 2024-05-13 to 2026-06-30
Total Return
-1.6%
CAGR
-0.8%
Sharpe Ratio
-0.71
Sortino Ratio
-1.07
Calmar Ratio
-0.42
Win Rate
0%
NSE Market Fit
9OUT OF 10
Very High Fit
This strategy is well-suited for current NSE market conditions.
Win rate quality Needs Caution
Risk-adjusted return Needs Caution
Drawdown control Excellent
Trade frequency (sample size) Needs Caution
Sharpe ratio Needs Caution
Monthly Returns Heatmap
2024
2025
Jan
—
—
Feb
—
—
Mar
—
—
Apr
—
—
May
—
—
Jun
—
-0.1%
Jul
—
—
Aug
—
-0.8%
Sep
—
—
Oct
-0.7%
—
Nov
—
—
Dec
—
—
Positive return Negative return
Performance vs Nifty 50
Nifty 50 comparison isn't available for this backtest period yet.
Anchor from a significant swing low or earnings date
Price retesting Anchored VWAP from above — first time
Sector trend supports the stock direction
Volume above average at the retest
Weekly chart still in uptrend
How This Strategy Works
1
Mark the VWAP on the intraday chart — this resets at 9:15 AM every NSE session
2
Wait for price to pull back to VWAP from above (bullish) or below (bearish) with a rejection candle
3
Enter in the direction of the prevailing trend — stop just beyond VWAP, target the day high or previous resistance
Entry & Exit Rules
✓ Entry Conditions
Anchor from a significant swing low or earnings date
Price retesting Anchored VWAP from above — first time
Sector trend supports the stock direction
Volume above average at the retest
Weekly chart still in uptrend
✕ Avoid When
Multiple rejections at Anchored VWAP — supply is significant
Anchor point too recent — insufficient data
Stock in news-driven phase — AVWAP less relevant
Low-liquidity stock — volume basis of AVWAP distorted
Around event dates — anchor effectiveness reduces
Risk Management Rules
Risk Per Trade
1.0%
of total capital
Min Capital
₹50,000
Hold Period
3–15 days
Segment
Equity, Futures
Common Mistakes to Avoid
⚠️ VWAP-based entries can look very different on low-liquidity stocks versus index majors — applying this strategy on illiquid names tends to produce misleading backtest results that don't hold up in live slippage conditions.
Full Backtest Report
Backtested on TATASTEEL ·
2024-05-13 to 2026-06-30 ·
Capital ₹100,000
Equity Curve
Live tracking coming soon
We're building forward-tested, paper-trade tracking for this strategy so you can see how it performs
on live NSE data — not just historical backtests. Check back soon.
Sample Trade Walkthrough
COALINDIA2024-01-22 · Long
WIN
Entry ₹
₹332.00
Stop Loss ₹
₹318.00
Target ₹
₹360.00
Exit ₹
₹358.00
Coal India broke out of a 3-month base on Nov 28. Anchored VWAP from that breakout date was at ₹318. On Jan 22, Coal India pulled back exactly to the Anchored VWAP (₹318) with declining volume — first retest. Strong bounce candle with 1.6x volume. Entered at ₹332. Stop at ₹318. Target ₹360. PSU rally continued, target hit in 15 sessions.
Strategy Parameters
The exact rules and default values this strategy uses — adjust them when you run a full backtest.
Parameter
Default
Min
Max
Type
Description
anchor_type
Week
select
Where to anchor the VWAP from
deviation_bands
1.0
0.5
3.0
decimal
Standard deviation bands from AVWAP
volume_mult
1.3
1.0
2.5
decimal
Volume spike required
atr_mult
1.5
0.5
3.0
decimal
Stop below AVWAP or ATR based
rr
2.0
1.0
5.0
decimal
Target RR
Frequently Asked Questions
Regular VWAP resets every day. Anchored VWAP lets you choose any starting point — an earnings date, a major low, a breakout bar — and calculates the volume-weighted average price from that point forward. It shows you the average price all participants have paid since a significant event, revealing institutional cost basis.
The most powerful anchor points are: (1) Quarterly earnings announcement dates, (2) Major swing lows (COVID low of March 2020 for long-term analysis), (3) IPO listing dates for newly listed stocks, (4) Major resistance breakout candles. Price returning to any of these anchored VWAPs often triggers institutional response.
When price pulls back to the Anchored VWAP from above and forms a rejection candle with below-average volume on the pullback, enter long. The Anchored VWAP acts as the institutional value area — buyers who entered at the anchor date defend this level. Stop loss goes 1 ATR below the AVWAP.
Yes. Anchor to the previous day's high, low, or close for intraday AVWAP analysis. A common setup is anchoring to the previous session's high volume node — this often acts as a magnet for price during the next session. Most charting platforms including TradingView support Anchored VWAP.
Related Strategies
Looking for alternatives? VWAP Bounce is a similar Intermediate strategy in the same VWAP category, with Very High NSE suitability.
MomentumIQ is an educational platform for strategy research and backtesting. We do not provide investment advice, recommendations, or tips. All backtest results are hypothetical, based on historical data, and for educational purposes only. Past performance is not indicative of future results. Backtested results may not account for brokerage, slippage, taxes, or other real-world costs. Please consult a SEBI-registered investment advisor before making any investment decisions.
 Navigation