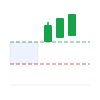
Trades the breakout from a defined consolidation or key level with volume confirmation. Well-suited for NSE where breakouts from established ranges produce reliable directional moves.
Complexity
Beginner
Easy to implement
NSE Suitability
High
9.2 / 10 score
Timeframe
15-Min / 1-Hour
Short to medium term
Best For
Intraday Traders
Intraday moves
Indicators Used
1
Volume
Win Rate (Backtest)
16.7%
Below 50% threshold
Avg Return / Trade
-0.29%
Per trade, after costs
Max Drawdown
-1.8%
Within typical range
Trades / Year
6
Small sample — interpret with caution
About the Opening Range Breakout (ORB) Strategy
# Opening Range Breakout (ORB)
Opening Range Breakout captures the directional momentum that often emerges once the market settles into its first 15 minutes to 1 hour of trading. The strategy identifies the high and low established during this opening period, then enters when price breaks beyond either boundary with volume confirmation. This setup works because the opening range typically contains overnight positioning and initial institutional flows, and a clean breakout often signals conviction in the emerging direction.
On NSE, ORB is particularly relevant due to the market's distinct opening volatility pattern. The first hour sees concentrated liquidity as traders react to overnight global cues and domestic news. The 9:15 AM opening bell generates sharp moves in major indices and liquid stocks, making breakouts more reliable than later sessions when ranges compress. This strategy suits both equities intraday and futures trading, where volume spikes during early hours confirm genuine breakout attempts rather than false moves.
The setup looks for a defined opening range followed by a clean break above resistance or below support, validated by volume expansion. Position sizing remains critical since early session volatility can be sharp, and stops are typically placed just inside the opening range.
Who This Strategy Is For
This Beginner strategy suits Intraday Traders comfortable with a 15-Min / 1-Hour timeframe and holding periods around Intraday. It's built for the Equity Intraday, Futures segment on NSE, so it fits traders who can check positions without needing intraday execution speed. Because it uses a small, well-known set of indicators, it's a reasonable starting point if you're new to systematic NSE trading.
Equity Curve (Backtest)
HIGH QUALITY
Tested on: BHARTIARTL
· 2024-05-13 to 2026-06-30
Total Return
-1.7%
CAGR
-0.9%
Sharpe Ratio
-1.05
Sortino Ratio
-1.58
Calmar Ratio
-0.5
Win Rate
16.7%
NSE Market Fit
9OUT OF 10
Very High Fit
This strategy is well-suited for current NSE market conditions.
Win rate quality Needs Caution
Risk-adjusted return Needs Caution
Drawdown control Excellent
Trade frequency (sample size) Needs Caution
Sharpe ratio Needs Caution
Monthly Returns Heatmap
2024
2025
2026
Jan
—
—
—
Feb
—
—
-0.3%
Mar
—
—
—
Apr
—
—
—
May
—
—
—
Jun
—
—
—
Jul
—
—
—
Aug
—
-0.5%
—
Sep
—
-0.5%
—
Oct
—
+0.9%
—
Nov
—
—
—
Dec
-0.8%
-0.5%
—
Positive return Negative return
Performance vs Nifty 50
Nifty 50 comparison isn't available for this backtest period yet.
Stock has institutional activity — FII or DII visible in OI
Opening 15-minute range is clean and well-defined
Volume increases steadily through opening range
Clear directional bias from sector and index
Overnight news was positive — gap not too wide
How This Strategy Works
1
Identify a consolidation zone — price must have been ranging for at least 5 sessions with defined support and resistance
2
Wait for a breakout candle closing beyond the level on volume 1.5× the 20-day average
3
Enter at the close of the breakout candle or the open of the next — stop below the breakout level, target is the measured move
Entry & Exit Rules
✓ Entry Conditions
Stock has institutional activity — FII or DII visible in OI
Opening 15-minute range is clean and well-defined
Volume increases steadily through opening range
Clear directional bias from sector and index
Overnight news was positive — gap not too wide
✕ Avoid When
Very wide opening range — over 2% — risk too high
Stock in news with speculation — unpredictable
F&O expiry day for the specific stock
Low-volume stocks — ORB whipsaws
When index shows opposite direction to stock
Risk Management Rules
Risk Per Trade
0.8%
of total capital
Min Capital
₹50,000
Hold Period
Intraday
Segment
Equity Intraday, Futures
Common Mistakes to Avoid
⚠️ Breakout strategies are prone to false breakouts and whipsaws, especially around low-volume sessions or just before major news/results. Confirm volume alongside the price breakout rather than trading the level alone.
Full Backtest Report
Backtested on BHARTIARTL ·
2024-05-13 to 2026-06-30 ·
Capital ₹100,000
Equity Curve
Live tracking coming soon
We're building forward-tested, paper-trade tracking for this strategy so you can see how it performs
on live NSE data — not just historical backtests. Check back soon.
Sample Trade Walkthrough
BAJFINANCE2024-03-05 · Long
WIN
Entry ₹
₹7,218.00
Stop Loss ₹
₹7,050.00
Target ₹
₹7,554.00
Exit ₹
₹7,548.00
Bajaj Finance opened with positive momentum. 15-minute ORB: ₹7,050–₹7,150 (range ₹100). Breakout above ₹7,150 at 9:45 AM with 2.4x ORB volume. Entered at ₹7,218 (0.1% buffer above breakout). Stop at range low ₹7,050. Target: ₹7,150 + ₹100 extension × 2 = ₹7,554. Hit at 1:30 PM.
Strategy Parameters
The exact rules and default values this strategy uses — adjust them when you run a full backtest.
Parameter
Default
Min
Max
Type
Description
orb_minutes
15
select
Opening range duration
volume_mult
1.5
1.0
3.0
decimal
Volume spike on breakout
atr_mult
1.5
0.5
3.0
decimal
Stop = ATR × multiplier
target_mult
2.0
1.0
5.0
decimal
Target = range × extension multiplier
max_trades
2
1
5
integer
Maximum trades allowed per session
Frequently Asked Questions
Opening Range Breakout (ORB) defines the price range formed during the first 15-30 minutes of NSE trading (9:15-9:30 or 9:15-9:45 AM) as the reference range, then enters trades when price breaks above the range high (long) or below the range low (short) with volume confirmation, capturing the session's primary directional move.
The 15-minute opening range (9:15-9:30 AM) provides the optimal balance for NSE trading — long enough to capture genuine price discovery beyond the initial open volatility, but short enough to still offer meaningful follow-through potential for the remainder of the session. The 5-minute range is too noise-prone; 30-minute sacrifices too much session time.
Require the breakout candle volume to be at least 1.5x the average volume of the opening range formation candles. For Nifty futures ORB, the total volume of the breakout 5-minute candle should clearly exceed the average of the 3 prior 5-minute candles that formed the range, confirming genuine institutional participation in the breakout.
Set the first target at 1x the opening range height (range width projected from breakout), exit 50% there. Let remainder trail using the opening range boundary (now support for longs) as the trailing stop, exiting on a close back inside the range. This structured approach captures most of significant ORB moves while protecting profits.
Related Strategies
Looking for alternatives? ATR Breakout is a similar Beginner strategy in the same Breakout category, with High NSE suitability.
MomentumIQ is an educational platform for strategy research and backtesting. We do not provide investment advice, recommendations, or tips. All backtest results are hypothetical, based on historical data, and for educational purposes only. Past performance is not indicative of future results. Backtested results may not account for brokerage, slippage, taxes, or other real-world costs. Please consult a SEBI-registered investment advisor before making any investment decisions.
 Navigation