Beginner★ Very High NSE FitDaily (Expiry)9/10 Popularity
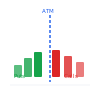
An options-based strategy extremely well-suited for NSE F&O markets. Leverages the unique characteristics of NIFTY and BANK NIFTY weekly options including time decay, volatility cycles, and expiry behaviour.
Complexity
Beginner
Easy to implement
NSE Suitability
Very High
9.2 / 10 score
Timeframe
Daily (Expiry)
Short to medium term
Best For
Options Traders
1–7 days moves
Indicators Used
1
Options Chain
Win Rate (Backtest)
26.9%
Below 50% threshold
Avg Return / Trade
-0.08%
Per trade, after costs
Max Drawdown
-5.6%
Within typical range
Trades / Year
26
Statistically reasonable sample
About the Option Chain Analysis Strategy
Option Chain Analysis is a straightforward approach that examines the distribution of open interest and trading volume across strike prices to identify levels where institutional interest clusters. By mapping where the bulk of call and put positions concentrate, traders can spot support and resistance zones that often act as price magnets during the trading day. The strategy capitalizes on the tendency for price to gravitate toward these high-activity strikes as expiry approaches.
On NSE, this method works particularly well because of deep liquidity in major indices like Nifty 50 and Bank Nifty, where option chains are consistently thick across multiple strikes. The daily expiry segment amplifies this effect—time decay accelerates into close, and gamma effects intensify around populated strikes, creating predictable intraday movement patterns. NSE's options market also exhibits distinct volatility clustering during specific sessions that correlate with institutional positioning visible in the chain.
The setup typically involves scanning the current expiry chain at market open, identifying the strikes with the highest combined open interest in calls and puts, and then watching how price interacts with these levels through the session. Confluence with nearby support and resistance from price action strengthens conviction.
Who This Strategy Is For
This Beginner strategy suits Options Traders comfortable with a Daily (Expiry) timeframe and holding periods around 1–7 days. It's built for the Options, Futures segment on NSE, so it fits traders who can check positions without needing intraday execution speed. Because it uses a small, well-known set of indicators, it's a reasonable starting point if you're new to systematic NSE trading.
Equity Curve (Backtest)
HIGH QUALITY
Tested on: RELIANCE
· 2021-07-05 to 2026-07-15
Total Return
-2.2%
CAGR
-0.5%
Sharpe Ratio
-0.21
Sortino Ratio
-0.32
Calmar Ratio
-0.09
Win Rate
26.9%
NSE Market Fit
9OUT OF 10
Very High Fit
This strategy is well-suited for current NSE market conditions.
Win rate quality Needs Caution
Risk-adjusted return Needs Caution
Drawdown control Excellent
Trade frequency (sample size) Good
Sharpe ratio Needs Caution
Monthly Returns Heatmap
2022
2023
2024
2025
2026
Jan
-0.8%
—
—
-0.7%
—
Feb
-0.5%
-0.5%
—
-1.2%
-0.7%
Mar
+1.9%
—
—
—
-0.9%
Apr
—
—
-0.6%
-0.8%
—
May
—
+0.9%
-0.7%
+1.9%
-0.1%
Jun
-0.1%
—
-0.9%
—
—
Jul
—
—
+1.8%
—
—
Aug
—
—
-1.1%
—
—
Sep
-0.1%
—
—
-0.5%
—
Oct
—
—
-0.9%
+0.9%
—
Nov
+1%
—
—
—
—
Dec
—
+0.9%
-0.6%
—
—
Positive return Negative return
Performance vs Nifty 50
Nifty 50 comparison isn't available for this backtest period yet.
Max pain clearly defined with large OI concentration
Significant call writing at resistance — ceiling visible
FII option positioning aligns with directional view
How This Strategy Works
1
Identify the market direction and key support/resistance levels on the NIFTY or BANK NIFTY chart
2
Select the appropriate strike price based on Delta and time to expiry — ATM or slightly OTM
3
Enter on a confirmed directional signal — manage with a 30–50% premium stop loss and defined target
Entry & Exit Rules
✓ Entry Conditions
PCR falling below 0.7 — bearish signal
PCR rising above 1.5 — bullish contrarian signal
Max pain clearly defined with large OI concentration
Significant call writing at resistance — ceiling visible
FII option positioning aligns with directional view
✕ Avoid When
PCR data incomplete early in the week
Around events — OI positioning changes rapidly
Using PCR alone without price action
Monthly vs weekly expiry data mixed — compare same type
When OI is very low — data not significant
Risk Management Rules
Risk Per Trade
1.0%
of total capital
Min Capital
₹1,00,000
Hold Period
1–7 days
Segment
Options, Futures
Common Mistakes to Avoid
⚠️ As with any systematic strategy, the most common mistake is deviating from the defined entry/exit rules mid-trade based on emotion rather than the backtested logic.
Full Backtest Report
Backtested on RELIANCE ·
2021-07-05 to 2026-07-15 ·
Capital ₹100,000
Equity Curve
Live tracking coming soon
We're building forward-tested, paper-trade tracking for this strategy so you can see how it performs
on live NSE data — not just historical backtests. Check back soon.
Sample Trade Walkthrough
NIFTY502024-03-11 · Long
WIN
Entry ₹
₹22,280.00
Stop Loss ₹
₹21,980.00
Target ₹
₹22,580.00
Exit ₹
₹22,574.00
Nifty OC analysis: PCR = 1.68 (very bullish). Max pain at 22,000 — Nifty was above max pain. Large call writing at 22,500 — ceiling, but still 220 points away. Significant put writing at 22,000 — floor support. FII net long in index calls ₹2,800 crore. All signals bullish. Bought 22,300 CE (Apr monthly, 20 DTE) at ₹112. Nifty moved to 22,574. CE value ₹286. 155% return.
Strategy Parameters
The exact rules and default values this strategy uses — adjust them when you run a full backtest.
Parameter
Default
Min
Max
Type
Description
pcr_threshold
1.2
0.5
2.5
decimal
Put/Call ratio level for signal
max_pain_buffer
0.5
0.0
1.5
decimal
% around max pain level for neutrality
oi_change_pct
10.0
5.0
30.0
decimal
% OI change needed for confirmation
iv_percentile
50
30
80
integer
Enter only when IV is below N percentile
profit_pct
40.0
20.0
70.0
decimal
Exit at N% gain
stop_pct
25.0
15.0
50.0
decimal
Exit at N% loss
Frequently Asked Questions
On NSE option chain: (1) Look at OI (Open Interest) at each strike — strikes with highest OI are key support/resistance levels, (2) Calculate PCR (Put/Call Ratio) = total put OI ÷ total call OI — PCR above 1.5 is bullish, below 0.7 is bearish, (3) Identify max pain — the price at which maximum options expire worthless — price often gravitates here on expiry.
Max pain is the strike price at which option sellers (who write most of the options) have maximum profit — meaning buyers lose maximum. NSE data shows that Nifty closes within ±100 points of max pain on about 65% of monthly expiries. For weekly BankNifty, max pain accuracy is lower — about 55%. Use it as one input, not a standalone trading system.
NSE publishes FII derivatives data daily. When FIIs are net long in index calls, it signals bullish view. Net long in index puts signals hedging or bearish view. Track the change in FII positions daily — sudden large put buying by FIIs is a warning signal. This data is available free on NSE India website under Reports → F&O → FII Statistics.
Related Strategies
Looking for alternatives? 0DTE Options Strategy is a similar Intermediate strategy in the same Options category, with Very High NSE suitability.
MomentumIQ is an educational platform for strategy research and backtesting. We do not provide investment advice, recommendations, or tips. All backtest results are hypothetical, based on historical data, and for educational purposes only. Past performance is not indicative of future results. Backtested results may not account for brokerage, slippage, taxes, or other real-world costs. Please consult a SEBI-registered investment advisor before making any investment decisions.
 Navigation